Country Data Graph Chart Layout With Statistical Line And Bar Analysis
Tags
Ratings & Reviews
Be the first to share your experience with this product. Your review helps others make better decisions!
Description
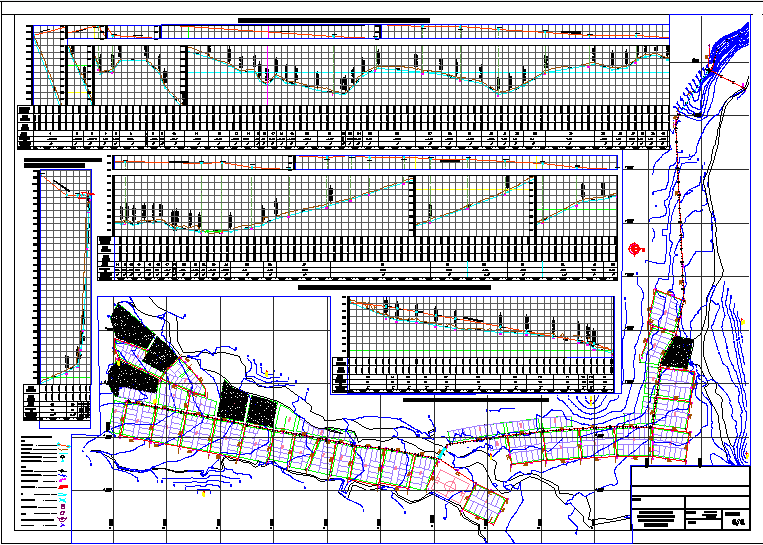
This country data graph presents a detailed analytical layout showing statistical line graphs, bar charts, and comparative data visualisation used for studying country-level information and geographic analysis. The country data graph illustrates multiple graph sections with plotted data points, trend lines, and measurement scales that help represent variations and comparisons between different regions or country datasets. The graph arrangement highlights elevation style profiles, plotted curves, and structured chart grids used for data interpretation and analytical reporting.
Uploaded by:
apurva munet
Tags
Ratings & Reviews
Be the first to share your experience with this product. Your review helps others make better decisions!