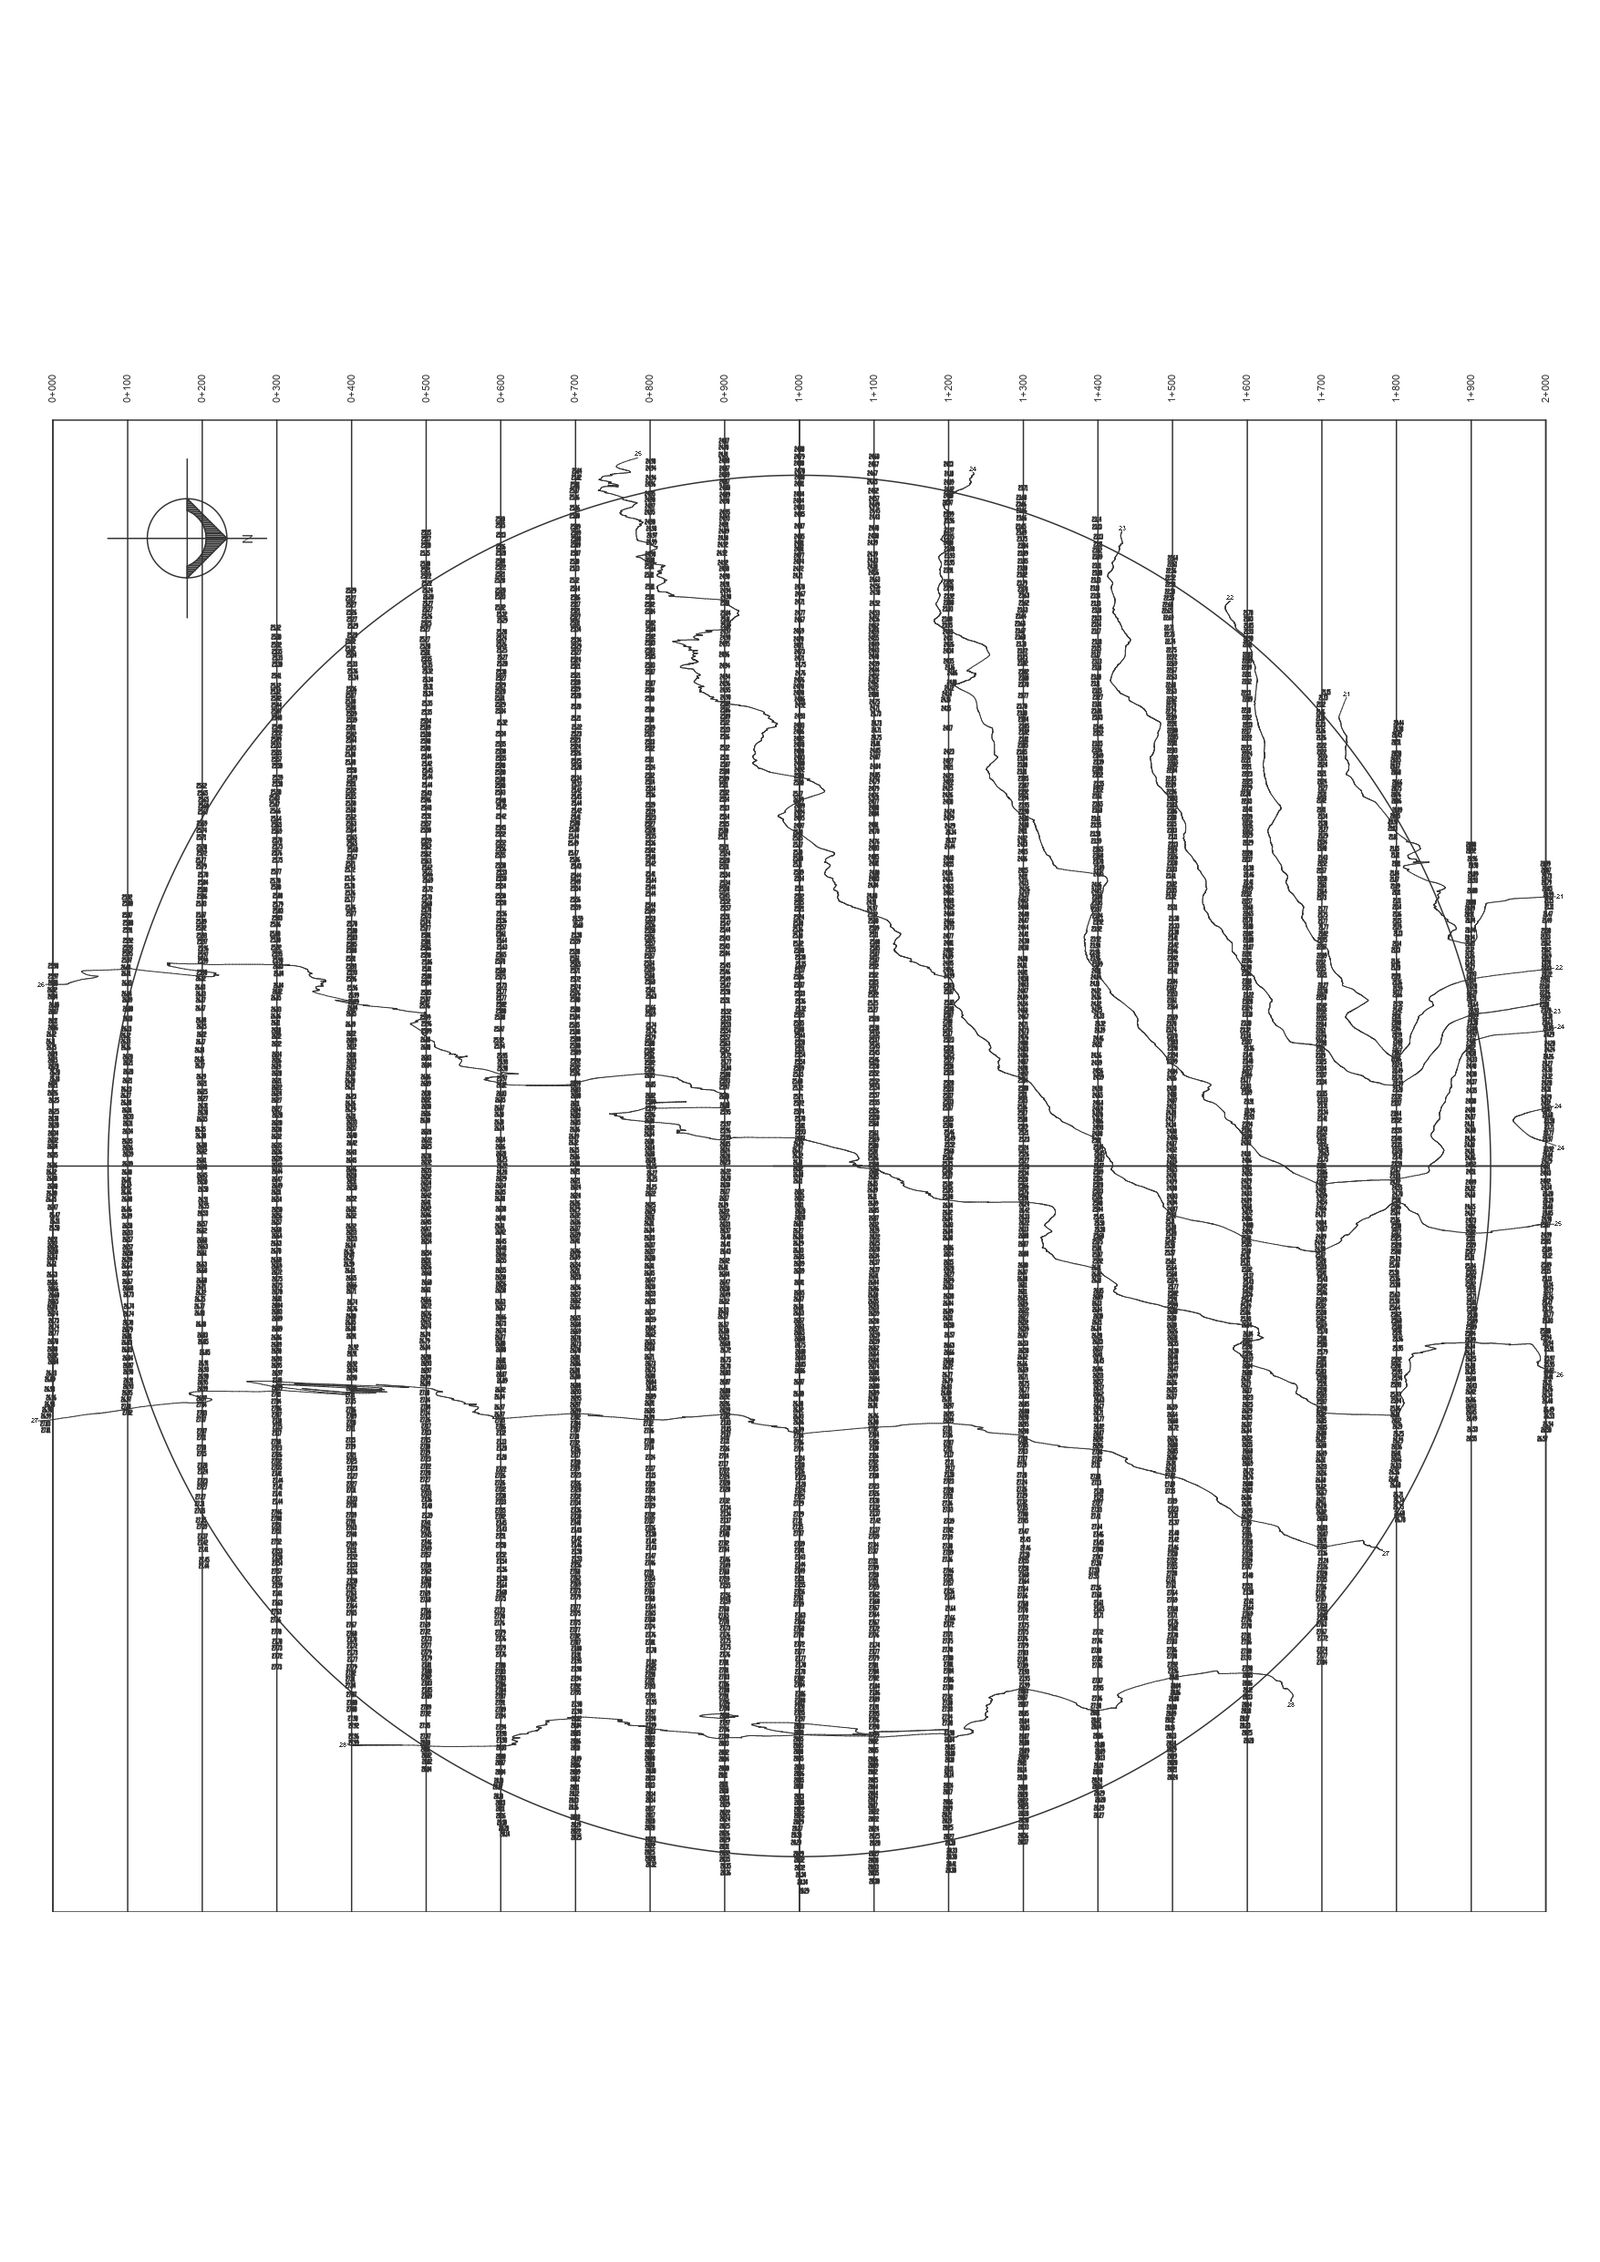
Earth heatwaves graph record in dwg form dwg autocad drawing .
Description
Access the historical data of earth's heatwaves through our meticulously crafted AutoCAD drawing, available in DWG format. Our DWG file presents a graphical representation of heatwave records, showcasing trends and values over time.Delve into the analysis of heatwaves with our CAD drawing, providing insights into temperature fluctuations and their impact on the environment. With precise graphical details and data visualization techniques, our 2D drawing offers a comprehensive overview of earth's heatwave patterns.Unlock the potential of your research or analysis with our CAD file, meticulously crafted to streamline the data presentation process and ensure accuracy in every detail. With our detailed AutoCAD drawing, you'll have all the tools you need to interpret and communicate heatwave data effectively. Explore our collection of DWG files and gain valuable insights into earth's climate trends.

Uploaded by:
Liam
White

